Trainings
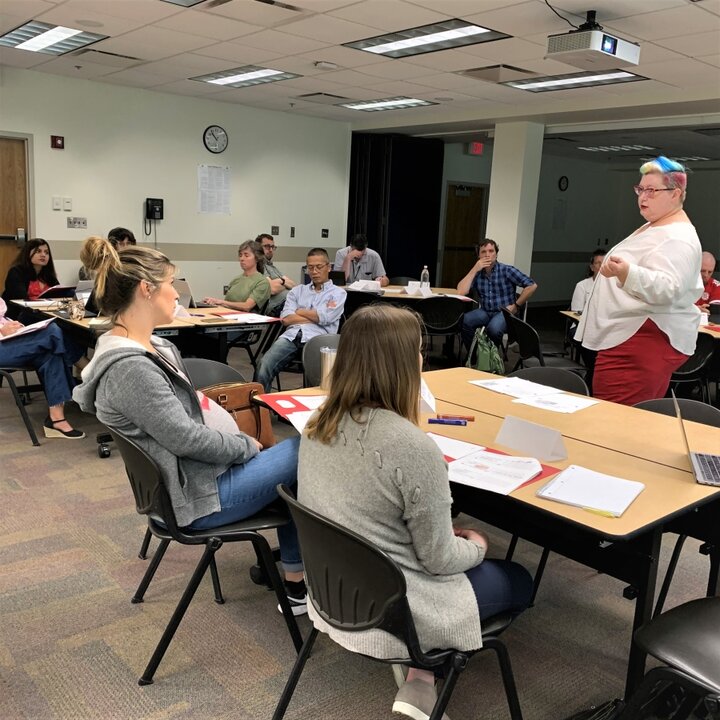
MERC offers trainings on various methodological, analytical, software, and evaluation related topics for a nominal fee. Existing customizable trainings are highlighted on this page, however, new content and topics may be developed to meet client needs. If you would like to discuss or schedule a training class from us, please contact us at merc@unl.edu.
Topics
Evaluation 101
Introduction to evaluation types, logic models (linear and circular), evaluation questions, evaluation methods, assessing improvement, and reporting. Sessions range from 2 to 6 hours long.

Qualitative Software
Covering either NVivo or MAXQDA, this training demonstrates the features of the chosen software, and guides participants through a mock data set, or a data set provided by the client. Sessions range from 1 to 6 hours long.
Understanding Data
Covers types of data, the impacts of collection methods on results, data stewardship, and data pitfalls. Can include the application of this information to client data to assess impacts, assumptions, and directions for future research. Sessions range from 2 to 6 hours long.

Data Collection
An Introduction to data collection, covering types of data, methods of data collection, writing questions, reaching participants, and biases. Includes activities, and can also cover data entry and data coding. Sessions range from 3 to 6 hours long. An hour-long, abbreviated Data Collection 101 session is available.
Quantitative Analysis
A hands-on introduction to basic data analysis using Excel. This training covers types of data, data coding, data entry, and summarizing and presenting data. Can also include inferential statistics and statistical tests. This session assumes some experience with Excel. Sessions usually range from 3 to 6 hours long.

Qualitative Analysis
This training includes a brief overview of data collection, methods of data collection, writing questions for qualitative answers, methods of hand coding qualitative data, and reporting. We can also review software options. Sessions range from 3 to 6 hours long.

Logic Models
This training includes traditional (linear) logic model, and/or culturally appropriate circular logic model training. Participants will learn how to complete a logic model – including inputs, outputs, and outcomes. Participants are encouraged to bring a current project to apply the training materials to their real-world examples during the exercises. Sessions range from 2 to 6 hours long.
Data Visualization
At its shortest, this training is an overview of examples of good/bad data visualization and explanation of best practices for creating data. Longer sessions include a hands-on walkthrough of creating basic data visualization features in Excel and Word. This session assumes some experience with Excel and Word. Sessions range from 1 to 6 hours long.

Creating Fact Sheets
This training is built around using client data to create fact sheets for their targeted audience. Includes a brief overview of how and why we create fact sheets, getting to know your data, and examples of fact sheets, followed by work in small teams to create drafts of fact sheets. This training takes at least one day (6 hours) but may be scheduled across two days - either as two 4-hour sessions or two 6-hour sessions.

Feedback from our training evaluations:
“Did a really good job presenting on something that can be sometimes overwhelming or unappealing to learn about. Very easy to follow with laid-back humor made the presentation easy to follow. I learned (honestly) more than I anticipated and enjoyed learning about better ways to collect data successfully. Thank you!”
“It was really a great training! Actually learned something I can do! Great job!”